Power BI, Excel, and reporting automation
Power BI Dashboard Development and Excel Automation Services
Qythera helps business teams replace manual reporting with Power BI dashboards, Excel automation, inventory dashboards, sales dashboards, reporting workflows, and Power Automate integrations.
Services
Choose the right reporting improvement for your team
Power BI Dashboard Development
Custom Power BI dashboard development services for sales, inventory, operations, finance, and management reporting. Build decision-ready BI dashboards with Qythera.
Excel Automation Services
Automate Excel reports, dashboards, manual data processing, VBA workflows, and recurring business reporting with Qythera's Excel automation services.
Inventory Dashboard Development
Build inventory dashboards for stock visibility, reorder tracking, warehouse performance, inventory aging, procurement insights, and real-time supply chain reporting.
Sales Dashboard Development
Create sales dashboards that track revenue, pipeline, targets, regional performance, customer trends, and sales team productivity with clear analytics.
Reporting Automation Services
Replace manual reporting with automated dashboards, scheduled reports, data refresh workflows, and connected reporting systems for faster business decisions.
Power Automate Integration
Connect Power BI, Excel, email, SharePoint, forms, and business apps with Power Automate workflows that reduce repetitive manual work.
Dashboard examples
Real dashboard styles for practical business reviews
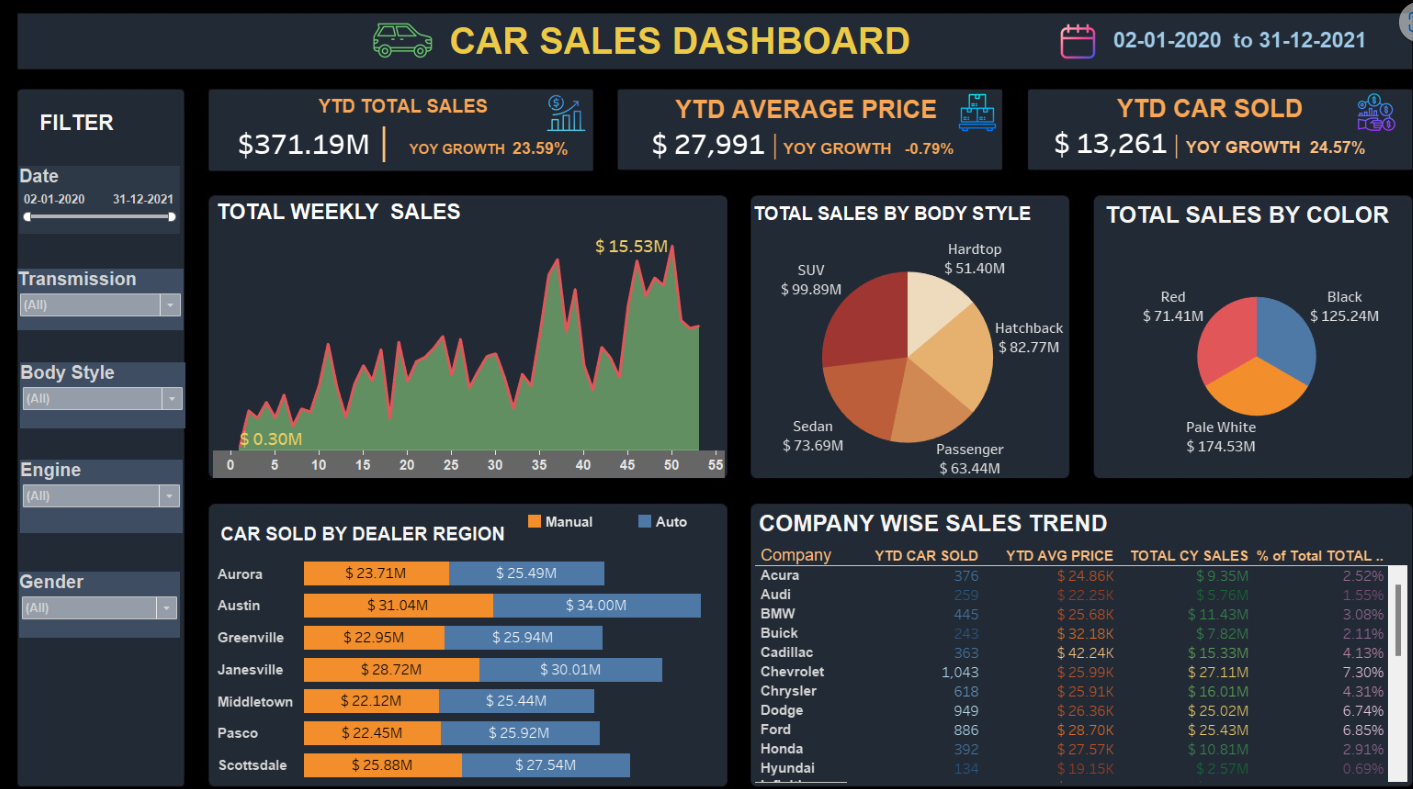
Power BI
Turn scattered business data into clear, interactive Power BI dashboards that leaders can use every day.
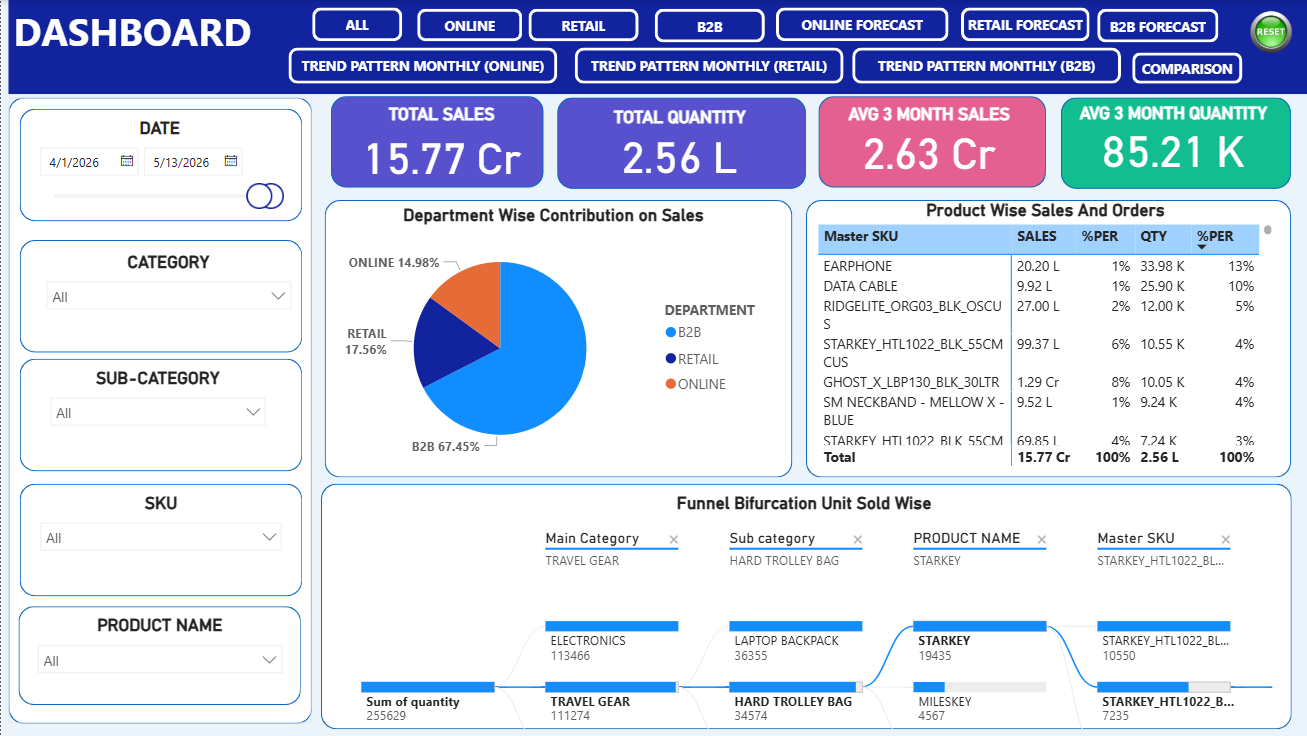
Excel Automation
Replace repetitive spreadsheet work with reliable Excel automation for reporting, data preparation, and business workflows.
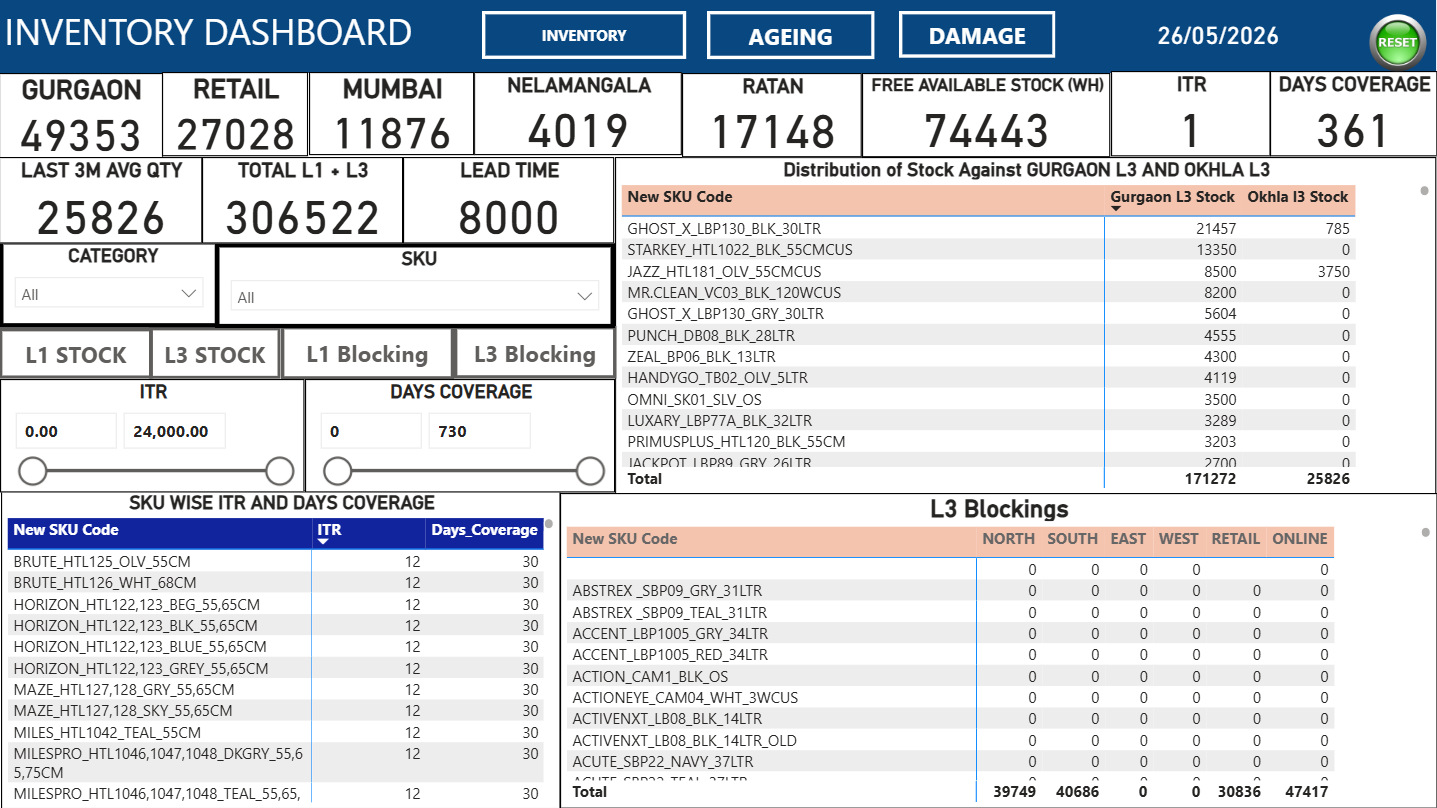
Inventory Dashboards
Get clearer stock visibility with dashboards built for inventory, procurement, warehouse, and operations teams.
Sales Dashboards
Track revenue, pipeline, targets, customers, and team performance through sales dashboards built for action.
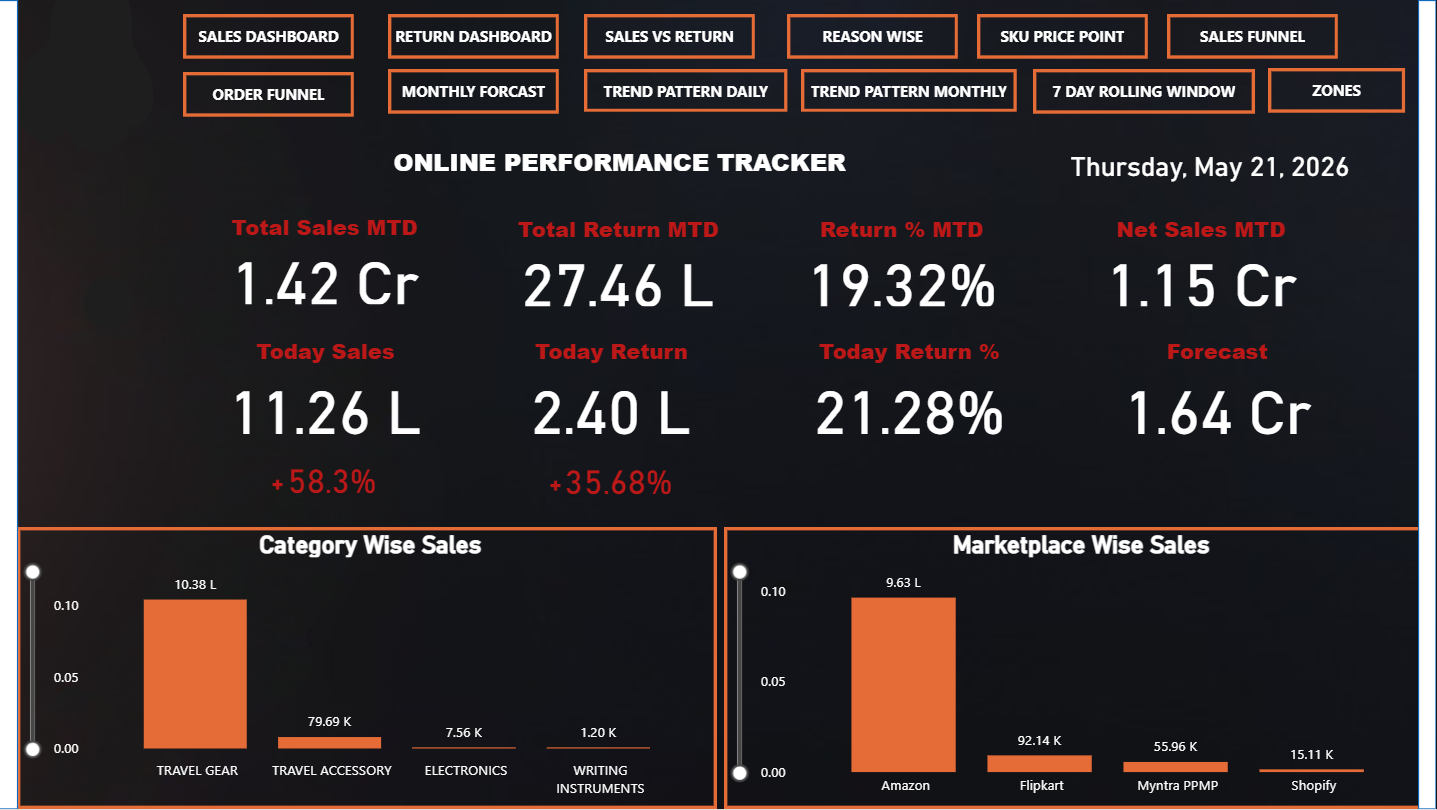
Reporting Automation
Automate recurring reports so teams spend less time preparing numbers and more time improving performance.
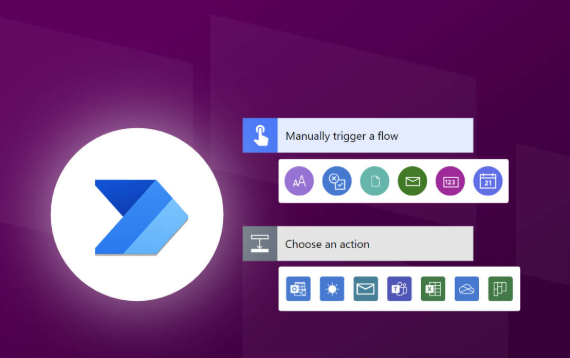
Power Automate
Connect apps, reports, approvals, files, and notifications with Power Automate workflows designed for business teams.
Industries
Reporting support for teams with recurring decisions
Qythera works with operations, sales, finance, inventory, retail, manufacturing, ecommerce, and service teams that need better visibility from existing data. The work is designed for practical adoption: cleaner reports, clearer KPIs, and dashboards that teams can use in real review meetings.
- Manufacturing and distribution reporting
- Retail, ecommerce, and sales operations dashboards
- Finance, management, and leadership reporting
- Inventory, procurement, and warehouse visibility
- Admin, HR, and recurring workflow automation
FAQ
Common questions
What does Qythera build?
Qythera builds Power BI dashboards, Excel automation systems, reporting automation workflows, inventory dashboards, sales dashboards, and Power Automate integrations.
Can you start from existing Excel reports?
Yes. Existing spreadsheets are often the best starting point because they reveal the current process, important metrics, and reporting pain points.
Do you work with small teams?
Yes. The service is suitable for founders, managers, and growing teams that need practical reporting improvements without a large analytics department.
Latest Articles
Business Intelligence & Reporting Insights
10 Inventory KPIs Every Warehouse Manager Should Track
Learn the most important inventory KPIs for stock visibility, inventory control, and warehouse performance.
What Is Reporting Automation and Why Businesses Need It
Learn how reporting automation helps businesses save time, improve reporting accuracy, and accelerate decision-making.
How to Create an Inventory Aging Report in Power BI
Learn how to identify slow-moving inventory, track aging stock, and build inventory aging dashboards in Power BI.
15 Power BI Dashboard Examples for Business Reporting
Explore real-world Power BI dashboard examples for sales, inventory, finance, executive reporting, and business analytics.
Top 10 Benefits of Excel Automation for Businesses
Learn how Excel automation helps businesses save time, reduce manual work, improve reporting accuracy, and boost productivity.
Start with your current reporting problem
Tell Qythera what your team prepares manually, which dashboard you need, or which workflow needs automation.