Qythera Service
Sales Dashboard Development Services
Track revenue, pipeline, targets, customers, and team performance through sales dashboards built for action.
Service overview
Build reporting that matches how your team works
Sales dashboard development gives commercial teams a reliable way to understand revenue performance, pipeline movement, customer behavior, and target progress. Without a clear dashboard, sales reviews often depend on manual spreadsheets, separate CRM exports, and delayed summaries. Qythera builds sales dashboards that organize those inputs into a focused view for leaders, managers, and sales representatives.
A strong sales dashboard should help the team see where growth is happening, where deals are slowing down, which products or regions are underperforming, and which customer groups need attention. The dashboard must support both strategic review and daily action. That means high-level KPIs for leadership, territory analysis for managers, and detailed drill-downs for follow-up conversations.
Our sales dashboard development process starts with the sales model: revenue sources, product groups, channels, sales stages, customer segments, targets, and reporting cadence. We then create dashboards that show trends, conversion, target achievement, team productivity, customer concentration, and exception areas. The outcome is a reporting system that turns sales data into practical next steps.
Sales Dashboard Development should be planned as a business system, not as a one-time design exercise. During delivery, Qythera translates current reporting habits into a cleaner operating model. That includes deciding which numbers belong on the first screen, which details should sit behind drill-down views, and which users need simple filters instead of complex report pages. This planning keeps the final output useful for daily work as well as leadership review.
The delivery also considers adoption. A technically correct dashboard or automation can still fail if users do not understand when to use it, which numbers to trust, or how to respond when an exception appears. For Sales Dashboards, we define the most important review moments: morning checks, weekly meetings, month-end reporting, operational follow-up, or management summaries. Those moments shape the page structure and the handover notes.
Data governance is handled in a practical way. We clarify where source data comes from, how often it should refresh, which fields are mandatory, and how calculation logic should be explained. This is especially important for teams in B2B sales teams, Retail and distribution, SaaS and services, Manufacturing sales, where small reporting errors can affect stock decisions, revenue reviews, customer follow-up, workload planning, or finance visibility.
A typical engagement includes a working reporting model, designed pages or automated outputs, validation against existing reports, documented assumptions, and a handover session. When required, we also prepare a roadmap for the next phase so the first version can expand into more advanced analytics, additional data sources, new workflow steps, or department-specific reporting views.
We also plan how the service will be maintained after launch. That means identifying who owns source files, who can request metric changes, how refresh problems should be reported, and which checks should happen before leadership relies on the output. This keeps Sales Dashboards useful after the first version is delivered and prevents the team from drifting back into disconnected manual reporting. It also gives new users a clearer path to understand the logic without depending on undocumented knowledge.
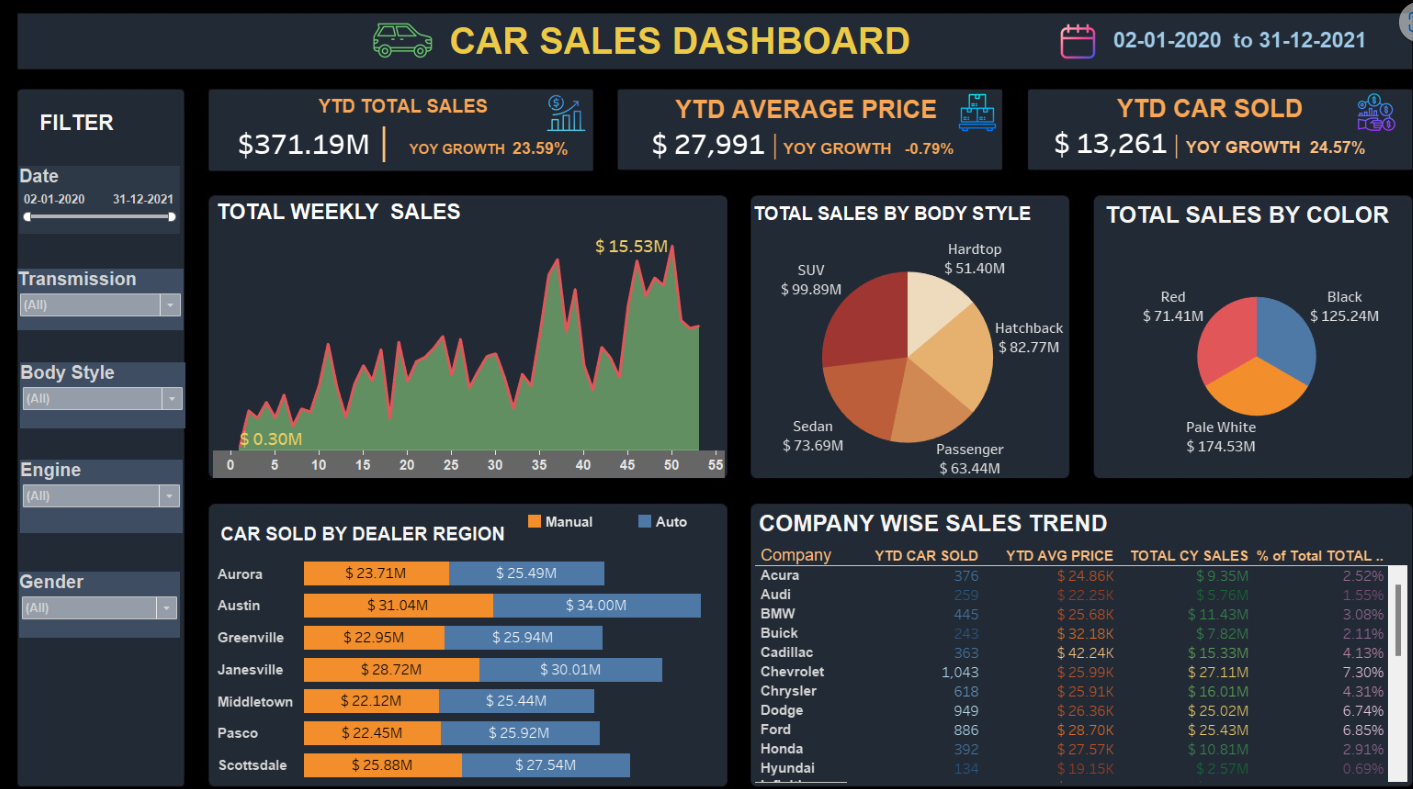
Examples are used during the build to keep the work concrete. For this service, that may include Revenue dashboard with monthly trends, target achievement, margin, product mix, and sales team comparisons. Pipeline dashboard showing open opportunities, stage conversion, expected value, aging, and stalled deal alerts. These examples help stakeholders react to something tangible and prevent the project from becoming a vague dashboard request. The result is a focused solution that gives the team a better way to see performance, discuss problems, and choose the next action.
Business benefits
What improves after the service is implemented
Clear revenue tracking by
Clear revenue tracking by month, region, product, salesperson, customer, channel, and business unit.
Better target management through
Better target management through achievement views, gap analysis, trend lines, and performance comparisons.
Improved pipeline discipline by
Improved pipeline discipline by showing deal stages, stalled opportunities, conversion ratios, and follow-up needs.
Stronger customer analysis through
Stronger customer analysis through repeat sales, high-value accounts, declining customers, and segment contribution.
Faster sales meetings because
Faster sales meetings because managers can review one dashboard instead of preparing separate performance files.
More accountable sales operations
More accountable sales operations with shared KPI definitions and consistent reporting across teams.
Process
A practical delivery process from discovery to rollout
1. Sales reporting discovery
Sales reporting discovery: we map current reports, CRM data, sales exports, target files, and review requirements.
2. Metric planning
Metric planning: we define revenue, pipeline, conversion, target, customer, product, and activity measures.
3. Data preparation
Data preparation: we clean sales transactions, customer records, stage values, dates, targets, and ownership fields.
4. Dashboard development
Dashboard development: we build views for executive summary, team performance, pipeline, customers, products, and regions.
5. Review and training
Review and training: we validate numbers with the sales team and train users to interpret trends, filters, and drill-downs.
Industries served
Built for teams with recurring data decisions
- B2B sales teams
- Retail and distribution
- SaaS and services
- Manufacturing sales
- Ecommerce teams
- Regional sales organizations
Dashboard examples
Examples your team can build toward
- Revenue dashboard with monthly trends, target achievement, margin, product mix, and sales team comparisons.
- Pipeline dashboard showing open opportunities, stage conversion, expected value, aging, and stalled deal alerts.
- Customer dashboard highlighting top accounts, declining buyers, repeat purchase behavior, and segment contribution.
- Regional dashboard comparing branches, territories, channel performance, and local growth opportunities.
Related services
Connect this service with the rest of your reporting system
Most reporting improvements work best when the surrounding workflows are connected. Explore related Qythera services that can extend this page into a broader business intelligence, automation, or dashboard roadmap.
FAQ
Common questions about Sales Dashboard Development
What can a sales dashboard track?
It can track revenue, targets, pipeline, conversion, customers, products, salespeople, regions, and performance trends.
Can it connect to CRM data?
Yes. Sales dashboards can use CRM exports, spreadsheets, databases, or structured sales reports as data sources.
Can managers see team-level performance?
Yes. Dashboards can include manager views, representative comparisons, target gaps, and activity-based insights.
Can targets be included?
Yes. Target files can be modelled with actual sales to show achievement, variance, and trend against plan.
Can the dashboard support weekly reviews?
Yes. It can be built around weekly sales meetings, with filters and pages designed for fast discussion.
Ready to improve Sales Dashboards?
Share your current reporting challenge and Qythera will suggest a focused next step for your data, dashboard, or automation workflow.
Start a Project Conversation