Qythera Service
Inventory Dashboard Development Services
Get clearer stock visibility with dashboards built for inventory, procurement, warehouse, and operations teams.
Service overview
Build reporting that matches how your team works
Inventory dashboard development helps businesses move from reactive stock checking to proactive inventory control. When stock data is spread across ERP exports, warehouse files, purchase records, sales reports, and manual trackers, teams struggle to know what is available, what is slow moving, and what needs attention. Qythera builds inventory dashboards that organize those signals into a clear reporting view.
A useful inventory dashboard does more than show total stock. It explains stock value, aging, reorder risk, demand movement, warehouse performance, supplier delays, and exceptions that can affect cash flow or customer delivery. We design dashboards around the questions inventory managers ask every day: which items are at risk, where excess stock is building, which products need replenishment, and which locations need follow-up.
The development process combines data modelling, KPI design, and practical dashboard layout. We can work with inventory exports, Excel trackers, ERP reports, purchase data, sales records, and warehouse movement logs. The final dashboard gives operations teams a structured way to monitor stock health, prioritize action, and communicate inventory status to leadership without rebuilding reports manually.
Inventory Dashboard Development should be planned as a business system, not as a one-time design exercise. During delivery, Qythera translates current reporting habits into a cleaner operating model. That includes deciding which numbers belong on the first screen, which details should sit behind drill-down views, and which users need simple filters instead of complex report pages. This planning keeps the final output useful for daily work as well as leadership review.
The delivery also considers adoption. A technically correct dashboard or automation can still fail if users do not understand when to use it, which numbers to trust, or how to respond when an exception appears. For Inventory Dashboards, we define the most important review moments: morning checks, weekly meetings, month-end reporting, operational follow-up, or management summaries. Those moments shape the page structure and the handover notes.
Data governance is handled in a practical way. We clarify where source data comes from, how often it should refresh, which fields are mandatory, and how calculation logic should be explained. This is especially important for teams in Manufacturing, Distribution, Retail chains, Ecommerce warehouses, where small reporting errors can affect stock decisions, revenue reviews, customer follow-up, workload planning, or finance visibility.
A typical engagement includes a working reporting model, designed pages or automated outputs, validation against existing reports, documented assumptions, and a handover session. When required, we also prepare a roadmap for the next phase so the first version can expand into more advanced analytics, additional data sources, new workflow steps, or department-specific reporting views.
We also plan how the service will be maintained after launch. That means identifying who owns source files, who can request metric changes, how refresh problems should be reported, and which checks should happen before leadership relies on the output. This keeps Inventory Dashboards useful after the first version is delivered and prevents the team from drifting back into disconnected manual reporting. It also gives new users a clearer path to understand the logic without depending on undocumented knowledge.
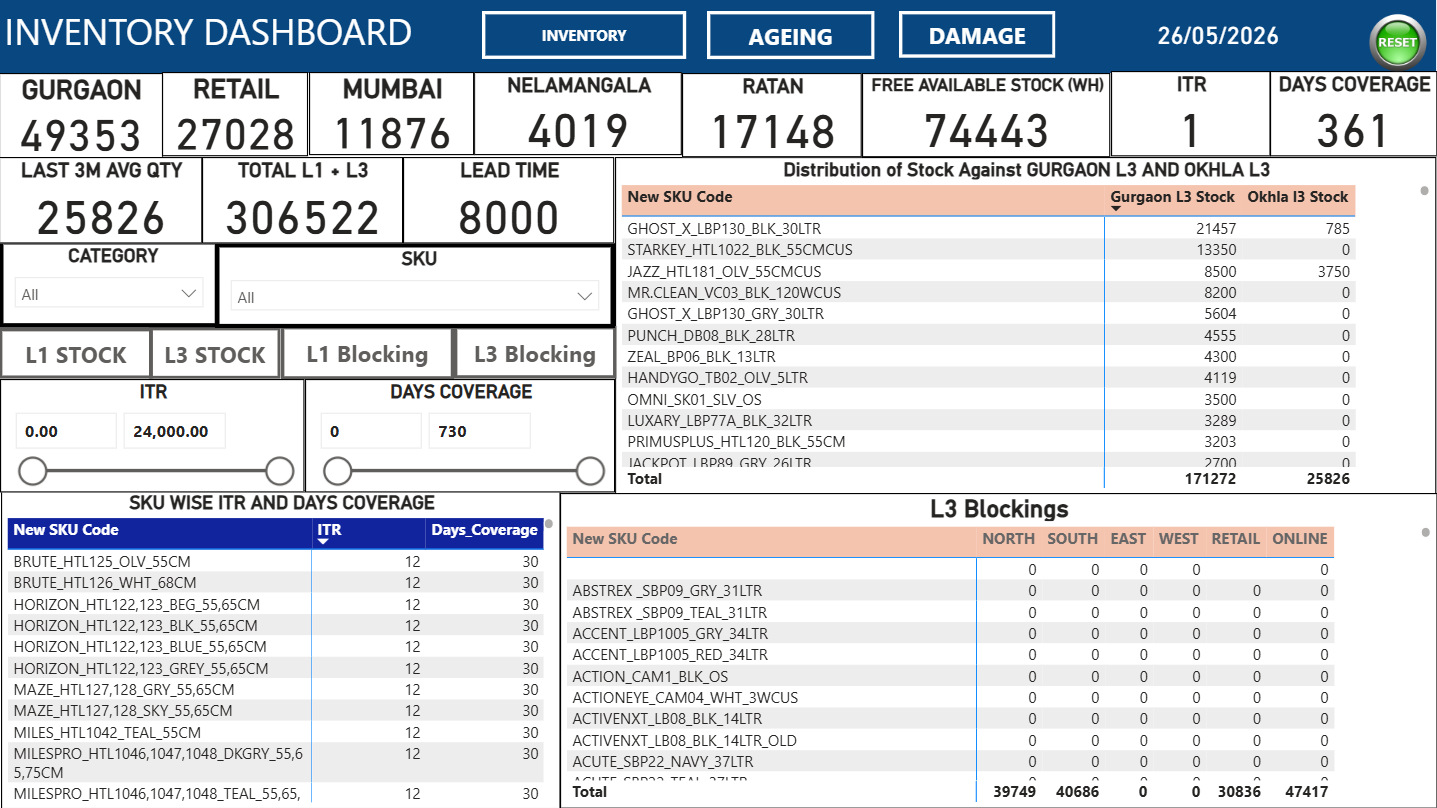
Examples are used during the build to keep the work concrete. For this service, that may include Stock health dashboard with available quantity, blocked stock, reorder risk, aging buckets, and excess inventory. Warehouse dashboard showing location performance, movement frequency, order readiness, and pending dispatch visibility. These examples help stakeholders react to something tangible and prevent the project from becoming a vague dashboard request. The result is a focused solution that gives the team a better way to see performance, discuss problems, and choose the next action.
Business benefits
What improves after the service is implemented
Better stock visibility across
Better stock visibility across locations, product groups, warehouses, departments, and time periods.
Earlier identification of stockouts,
Earlier identification of stockouts, overstock, aging inventory, dead stock, and reorder exceptions.
Improved working capital control
Improved working capital control because leaders can see where money is tied up in slow-moving items.
Stronger procurement planning through
Stronger procurement planning through demand trends, purchase cycle insights, and supplier performance views.
Fewer manual inventory reports
Fewer manual inventory reports because recurring analysis can be refreshed and shared through dashboards.
Clearer communication between warehouse,
Clearer communication between warehouse, sales, purchase, and finance teams through one reporting view.
Process
A practical delivery process from discovery to rollout
1. Inventory data discovery
Inventory data discovery: we identify source systems, item masters, stock movement files, purchase records, and reporting gaps.
2. KPI design
KPI design: we define measures such as stock value, reorder level, fill rate, aging days, slow movement, and variance.
3. Model development
Model development: we clean item codes, categories, dates, quantities, locations, and supplier fields for reliable reporting.
4. Dashboard build
Dashboard build: we create pages for overview, stock risk, aging, warehouse performance, procurement, and detailed analysis.
5. Validation and rollout
Validation and rollout: we compare dashboard outputs with existing reports, resolve mismatches, and train users on interpretation.
Industries served
Built for teams with recurring data decisions
- Manufacturing
- Distribution
- Retail chains
- Ecommerce warehouses
- Pharma supply teams
- Food and FMCG operations
Dashboard examples
Examples your team can build toward
- Stock health dashboard with available quantity, blocked stock, reorder risk, aging buckets, and excess inventory.
- Warehouse dashboard showing location performance, movement frequency, order readiness, and pending dispatch visibility.
- Procurement dashboard with supplier delays, purchase order status, lead time trends, and replenishment planning.
- Inventory finance dashboard that tracks stock value, slow-moving capital, write-off risk, and category-level exposure.
Related services
Connect this service with the rest of your reporting system
Most reporting improvements work best when the surrounding workflows are connected. Explore related Qythera services that can extend this page into a broader business intelligence, automation, or dashboard roadmap.
FAQ
Common questions about Inventory Dashboard Development
What data is needed for an inventory dashboard?
Common inputs include item master data, stock balances, purchase orders, sales or issue data, warehouse locations, and movement history.
Can the dashboard show reorder alerts?
Yes. Reorder logic can be built using minimum stock levels, demand trends, lead times, and custom business rules.
Can it handle multiple warehouses?
Yes. Dashboards can compare stock by location, warehouse, branch, region, or business unit.
Do you build inventory dashboards in Power BI?
Yes. Most inventory dashboards are built in Power BI, often with Excel or ERP exports as the source.
Can finance teams use the dashboard too?
Yes. Inventory value, aging, slow movement, and stock exposure views are useful for finance and leadership reviews.
Ready to improve Inventory Dashboards?
Share your current reporting challenge and Qythera will suggest a focused next step for your data, dashboard, or automation workflow.
Start a Project Conversation